I Gave Claude Code a Process ID and Let It Debug My App
A few weeks ago I was doing performance benchmark testing on a distributed backend service I maintain. Nothing dramatic. Just the routine load testing you do to validate behaviour under real traffic conditions.
Then I noticed something. CPU and memory weren’t spiking. They were creeping. Slowly, steadily, over the course of the test run. No alerts, no crashes. Just this quiet upward drift that you’d only catch if you were watching closely.
Slow leaks like this are the hardest kind to debug. A spike has a cause you can trace. A creep has a pattern you have to piece together from multiple sources: thread dumps, heap analysis, log correlation. It usually takes a while.
Trying Something I Hadn’t Tried Before
I’ve been using Claude Code for a while now. Most of the time I use it in fairly predictable ways: code generation, refactoring, explaining unfamiliar libraries, reviewing logic. Useful every day, but within a well-worn pattern.
This time, something made me want to push it differently.
Instead of feeding Claude pre-captured snapshots, I wondered: what would happen if I gave it the process ID of the running application and just let it explore?
So I did exactly that. I told Claude the PID, said the application was running under load and something was causing CPU and memory to creep up, and asked it to investigate.
What Happened Next
What followed was interesting to watch. Claude started running its own diagnostic commands: jstack to capture thread state, ps to monitor CPU and memory in real time, and lsof to check file descriptor usage. It wasn’t waiting for me to tell it what to run. It was building a picture the way an experienced engineer would, one data source at a time.
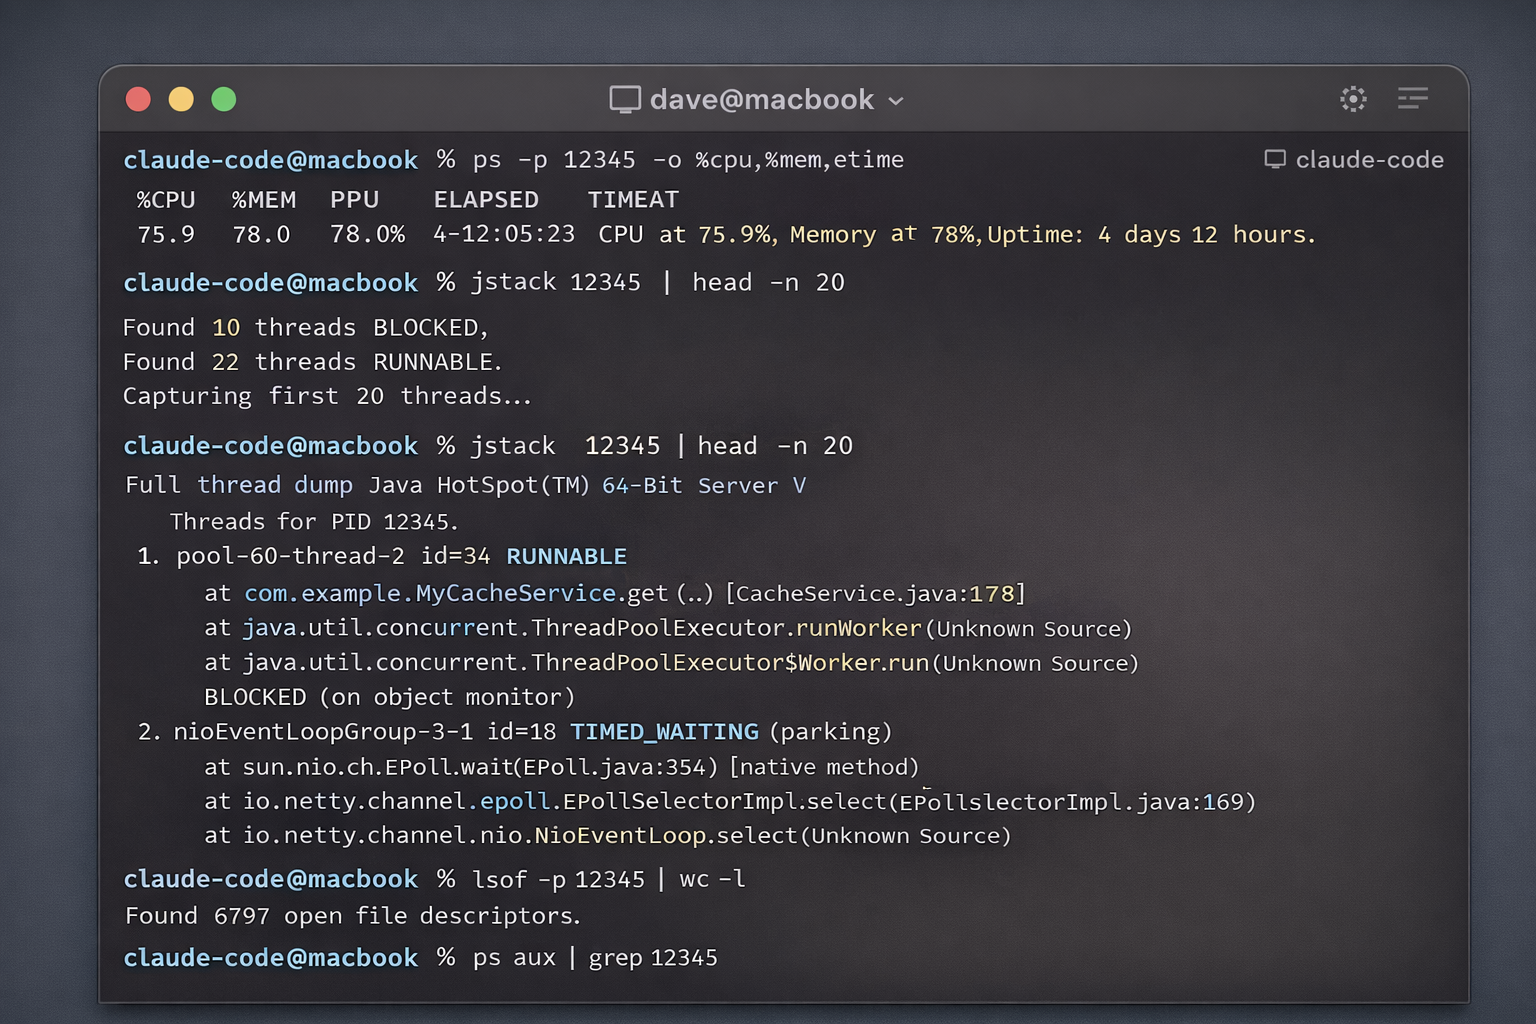 AI-generated illustrations. I can’t share the real screenshots due to privacy reasons.
Within a few minutes it had identified three things:
Busy and blocked threads. Several worker threads were consistently blocking on cache operations. These were calls that should have been asynchronous but weren’t, and they were tying up the thread pool under load.
Worker pool exhaustion. With those threads stuck, the fixed-size worker pool was filling up. New work was queuing, then timing out, creating a backpressure problem that got worse as traffic sustained.
Event loop saturation. The underlying framework uses a non-blocking, event-driven architecture. The blocking calls were violating that contract and starving the event loop. That explained the CPU drift pattern perfectly.
It Fixed the Code Too
Once Claude had the diagnosis, it didn’t just report back and wait. It proposed fixes: rewriting the problematic sections to use proper async patterns and converting the blocking cache calls to non-blocking equivalents that respected the framework’s design.
I reviewed the changes, they made sense, and initial testing showed a meaningful improvement in throughput under the same load conditions.
But that wasn’t the most interesting part.
The Thing I Didn’t Ask For
After addressing the identified issues, Claude generated a circuit breaker pattern for the event listener.
Its reasoning: even with the fixes in place, if the worker pool ever saturates again under extreme conditions, without protection the service would start rejecting work in a cascading way that could destabilise the whole thing. The circuit breaker would detect that pattern early and stop accepting new work gracefully until recovery, rather than letting it spiral.
I hadn’t asked for this. It wasn’t in my brief. Claude just noticed the vulnerability and closed it.
That’s the moment that stuck with me.
What I Took Away From This
A few things struck me after this:
The “give it a PID” idea was new to me. I’d used Claude Code for code generation and refactoring plenty of times. Using it as a real-time observability partner on a live process hadn’t occurred to me until I just tried it. There’s probably a lot of unexplored territory in this direction.
It reduces the expertise gap. JVM profiling, event-loop debugging, thread dump analysis. These are niche skills and not everyone on a team has deep fluency in all of them. Having an AI that can read and reason about that output means the knowledge is more accessible to everyone.
The unsolicited circuit breaker mattered. Not because it was clever (it was), but because it reflected something I want from a collaborator: someone who thinks about the problem beyond the literal scope of what you asked. That’s what turned this from a useful tool into something that felt genuinely different.
Still Testing
I want to be honest. The changes are still being validated under sustained load. I’m not claiming a solved problem or a dramatic production win yet. But the direction is right, the initial numbers are encouraging, and the process of getting here was much faster than it would have been otherwise.
Capturing diagnostics, correlating data sources, forming hypotheses, testing fixes. What would have taken me days of manual work happened in an afternoon.
If you’ve tried anything similar with Claude Code or other agentic tools in a real debugging context, I’d love to hear about it.